
Share

As we shape Wiregrass Electric Cooperative’s future, our mission as a member-owned cooperative is reflected in our 2025 Annual Meeting theme: Stronger Together.
The past year brought both expected and unexpected challenges. Economic conditions continued to evolve—sometimes gradually, sometimes abruptly—and we know many of our members felt those changes in everyday expenses. We felt them as well, and we responded thoughtfully, always keeping our commitment to reliable and affordable power at the forefront.
Our cooperative navigated a complex environment marked by rising costs, equity considerations, and increasing energy demand. We took deliberate steps to adjust our rate structure to better account for demand-related costs, balancing today’s realities with long-term sustainability. Throughout this process, transparency and integrity remained central, with our members guiding every decision.
One of the most significant factors affecting wholesale power costs continues to be peak demand, particularly during winter mornings between 6 and 9 a.m. Reducing demand during these critical hours benefits the entire membership, and we appreciate the ways our members work alongside us in this shared effort. Together, we are strengthening the cooperative for the future.
Beyond operational challenges, we remain committed to making a positive impact in the communities we serve. Our approach is rooted in consistency—showing up for our members and supporting them in meaningful, practical ways.
As we move forward, our work is guided by our core values: reliability, affordability, integrity, and a steadfast commitment to doing what’s right. While challenges will continue to arise, we face them confidently—stronger together—with careful planning, collaboration, and our members’ best interests always in mind.
Thank you for placing your trust in Wiregrass Electric Cooperative. It is a responsibility we carry with pride, knowing that together we are building a strong, resilient future.


Wiregrass Electric Cooperative once again delivered one of the most reliable service records in the region, achieving a 99.9% system reliability score for 2025—translating to fewer than 100 minutes of annual downtime per member. WEC’s members experienced uninterrupted power in nearly all circumstances, underscoring our transportation resilience and preventive planning.
In 2025, our system reached a new peak demand of 142 megawatts, just 2 MW shy of the all-time high set in December 2022. Despite rising energy demand, our ability to maintain high reliability reflects the effectiveness of our proactive capacity and infrastructure planning.
Our continued investment in system upgrades—including smart meters, advanced transformer monitoring and substation automation—is backed by careful maintenance of right-of-way clearances and vegetation management programs to prevent outages before they occur. These enhancements ensure long-term resilience and reduce outage risks caused by storms, vegetation interference or aging infrastructure. Partnerships are also key. Our collaboration with PowerSouth Energy Cooperative delivers a balanced energy portfolio and
cost-effective power supply. Under this arrangement, WEC benefits from generation pooling and long-range planning that keeps energy secure and rates stable.
Safety is foundational to reliability. WEC crews participate regularly in NRECA Safety Summits, where they exchange best practices and enhance on-site awareness. Our internal safety initiatives emphasize personal protective equipment, first-aid training and flagger protocols to support safe, efficient restoration efforts.
To gauge our success, our members rate us highly across critical reliability metrics. In recent surveys, we scored 9.4 out of 10 for reliability and employee knowledge, and 9.2 out of 10 for courteous service and timely restoration. These ratings illustrate that our behind-the-scenes reliability work translates into real satisfaction for the people we serve.
Together, these efforts—strategic infrastructure investments, grid partnerships, safety-focused operations and clear member communications—embody how WEC lives our mission of being Stronger Together, powering reliably and safely for every member, every day.
Innovation continues to be a driving force behind WEC’s progress. In 2025, we expanded our implementation of demand-based rates.
Currently set at $2.50 per kilowatt, the demand rate more fairly covers the cooperative’s energy costs based on how WEC is actually charged for wholesale power. Such a structure encourages members to shift their usage out of high-demand periods, helping control wholesale costs.
On the technology front, we upgraded key substations with advanced monitoring systems, real-time voltage regulation and smart grid automation to better manage load distribution and enhance responsiveness to system anomalies. These enhancements increase grid resiliency, reduce outagedurations and optimize energy delivery across our service territory.
Additionally, WEC took an active role in supporting major regional infrastructure, such as the Highway 52 expansion, which received critical state investment to enhance economic connectivity from Hartford to Dothan. Our involvement included hosting stakeholder forums and providing technical insight during the planning process. These efforts reflect our deep commitment to community planning and long-term development.
Combined, these efforts showcase the way WEC blends innovation and member-centered planning to strengthen service, encourage modernization and drive regional progress.

At WEC, our member services team consistently goes above and beyond to treat each member as a trusted partner—not just a customer. From the moment you reach out, whether by phone, email or visiting one of our full-service offices in Hartford, Dothan, Ashford or Samson, our goal is to make your experience effortless, respectful and helpful. With 26,356 total meters, our commitment to personalized service is what sets us apart in the Wiregrass region.
Every outage is reflected in our interactive outage map, giving members real-time visibility into service status. This transparency helps reduce uncertainty during service interruptions, even before a crew arrives to restore power.
Our team also provides educational content whenever needed, such as safety information about using generators during outages and power line safety tips to keep our community safe and informed.
We’ve significantly enhanced our online and mobile platforms this year. WEC’s mobile app and secure member portal now allow:
Feedback across our service platforms continues to reflect high satisfaction. Our usability surveys show:
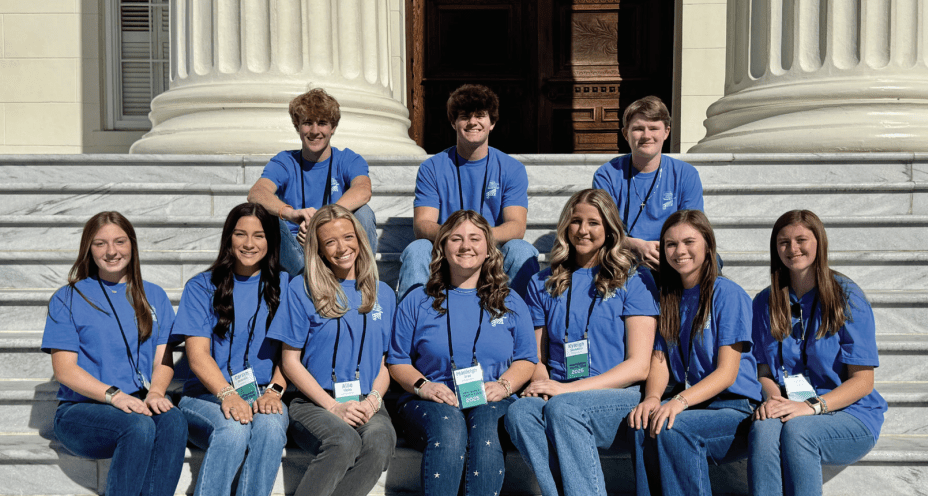
We continued to invest in youth programs such as the Youth Tour, local government days and hands-on electrical safety demonstrations.
Wiregrass Electric sponsored a group of high school juniors for the Alabama Youth Tour in Montgomery and selected two to attend the national event in Washington, D.C. We also set aside a day to bring the students to our headquarters in Hartford where they had a chance to ask questions of state legislators and tour the facility, learning how the cooperative works.
Once again, our lineworkers participated in the annual Worlds of Work event held at the National Peanut Festival Fairgrounds in Dothan and hosted by Southeast Alabama Works. Students from around the Wiregrass had the chance to speak with our lineworkers and learn more about what they do to keep the lights on.
Through Alabama Living magazine, the My Hometown Power bill inserts, social media updates and e-newsletters, we keep members informed and connected on everything from energy efficiency tips to upcoming cooperative events and features on our members.

Serving our community is one of Wiregrass Electric 2024 Cooperative’s core principles, and one way we do that is through Operation Round Up.
Since it was launched in 2015, our Operation Round Up program has exceeded $1 million in total donations, funding scholarships, emergency services and local nonprofits. Because our members voluntarily round up their monthly bills to the nearest dollar, we’ve been able to invest in our communities through grants for first-responders, local schools and nonprofit organizations. Through scholarships, we’ve invested in local students beginning traditional college careers as well as those attending the Wallace Community College lineworker program.
Each month, we celebrate our Silent Heroes of the Wiregrass by honoring someone who doesn’t seek fanfare as they help others. The program, a partnership with WTVY, has been ongoing since November 2016 with more than $100,000 awarded to inspiring individuals making a difference across the Wiregrass.
Our Charitable Golf Tournament continues to be a cornerstone fundraiser for the Operation Round Up Charitable Foundation. A board of nine volunteer cooperative members helps us put these dollars back into our community. We believe in empowering our communities and providing the support to make them stronger.
Fire/Rescue/Police
Schools
Nonprofit community organizations
Scholarships
Individual Grants
Media partnerships
(Silent Heroes)
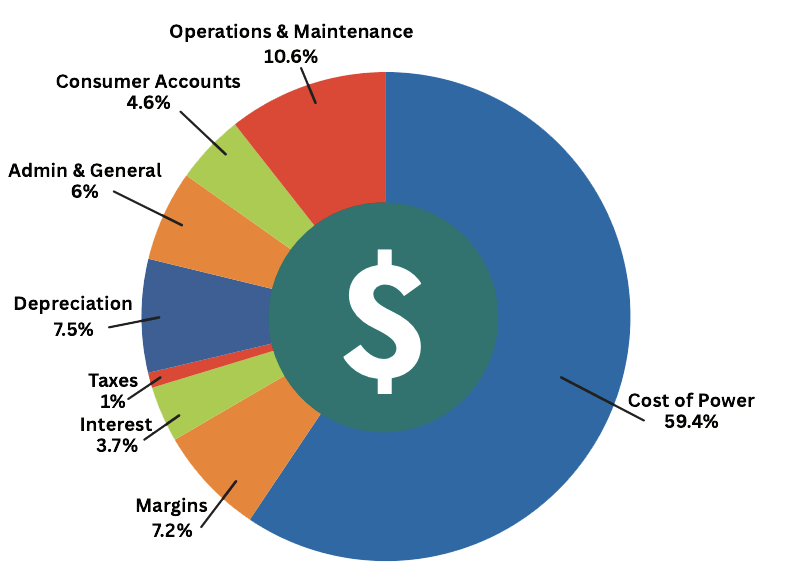
Through thoughtful financial management and cost-recovery strategies, WEC maintained strong equity and returned over $22 million in capital credits to members since inception. Our How Each Dollar Is Spent breakdown illustrates our commitment to transparency and efficiency.
Total Assets: $170.7 million
Patronage Capital: $78.6 million
Total Operating Revenue: $66.6 million
Net Margins: $6.8 million
Capital Credits Returned (Lifetime): $22 million
Statements are for the years ended April 30, 2025, and April 30, 2024.
| Utility Plant | 2025 | 2024 |
|---|---|---|
| Utility Plant | $156,119,252 | $148,604,918 |
| Construction Work in Progress | 430,083 | 327,015 |
| Total Utility Plant | $156,549,335 | $148,931,933 |
| Less: Accumulated Depreciation | $33,517,215 | $31,180,127 |
| Net Utility Plant | 123,032,120 | 117,751,806 |
| Other Assets and Investments | 2025 | 2024 |
|---|---|---|
| Investments in Associated Organizations | 26,470,460 | 25,634,348 |
| Temporary Cash Investments | 2,000,000 | 2,000,000 |
| Economic Development Notes Receivable, Less Allowance of $150,000 in 2025 and 2024 | 841,312 | 1,273,066 |
| Total Other Assets and Investments | 29,311,772 | 28,907,414 |
| Current Assets | 2025 | 2024 |
|---|---|---|
| Cash and Cash Equivalents | 10,548,006 | 11,363,624 |
| Accounts Receivable: Customers, Less Allowance for Credit Losses of $25,479 in 2025 and $39,101 in 2024 | 2,265,748 | 2,147,047 |
| Other Accounts Receivable | 47,697 | 53,804 |
| Unbilled Revenue | 3,544,080 | 3,078,708 |
| Prepaid Power | 2,105,890 | — |
| Materials and Supplies | 1,458,641 | 1,512,161 |
| Other Current and Accrued Assets | 433,502 | 425,252 |
| Total Current Assets | 18,297,674 | 20,686,486 |
| Deferred Charges | 2025 | 2024 |
|---|---|---|
| Work Plan and Preliminary Charges | 48,254 | 65,285 |
| Total Deferred Charges | 48,254 | 65,285 |
| Total Assets | 2025 | 2024 |
|---|---|---|
| Total | $170,689,820 | $167,410,991 |
Statements are for the years ended April 30, 2025, and April 30, 2024.
| Equities | 2025 | 2024 |
|---|---|---|
| Memberships | $99,560 | $97,880 |
| Patronage Capital | 78,649,155 | 74,055,283 |
| Other Equities | 7,808,820 | 7,034,838 |
| Total Equities | 86,557,535 | 81,188,001 |
| Noncurrent Liabilities | 2025 | 2024 |
|---|---|---|
| Notes Payable, Net of Current Maturities | 69,364,244 | 74,136,888 |
| Right-of-Use Obligation, Net of Current Maturities | 1,087,941 | 1,241,892 |
| Total Noncurrent Liabilities | 70,452,185 | 75,378,780 |
| Current Liabilities | 2025 | 2024 |
|---|---|---|
| Current Maturities on Notes Payable | 3,241,475 | 1,498,103 |
| Current Maturities on Right-of-Use Obligations | 326,638 | 351,086 |
| Accounts Payable: Trade | 390,087 | 309,736 |
| Accounts Payable: Purchased Power | 1,633,915 | — |
| Customer Deposits | 2,674,539 | 2,524,307 |
| Accrued Liabilities: Taxes | 1,570,370 | 1,521,554 |
| Other Accrued Liabilities | 1,316,044 | 1,395,137 |
| Total Current Liabilities | 11,153,068 | 7,599,923 |
| Deferred Credits | 2025 | 2024 |
|---|---|---|
| Deferred Revenue | 2,083,333 | 2,800,000 |
| Consumer Energy Prepayments | 443,699 | 444,287 |
| Total Deferred Credits | 2,527,032 | 3,244,287 |
| Total Equities and Liabilities | $170,689,820 | $167,410,991 |
Statements are for the years ended April 30, 2023, and April 30, 2022.
| Operating Revenue | 2023 | 2022 |
|---|---|---|
| Revenue From Contracts With Customer | $55,916,676 | $49,025,651 |
| Other | 890,631 | 1,318,772 |
| Total | 56,807,307 | 50,344,423 |
| Operating Expenses: | 2023 | 2022 |
|---|---|---|
| Cost of Power | 36,951,549 | 31,300,036 |
| Distribution – Operations | 2,839,480 | 2,572,829 |
| Distribution – Maintenance | 3,645,411 | 3,163,699 |
| Consumer Accounts Expense | 3,382,332 | 3,199,830 |
| Administrative and General | 2,919,980 | 2,428,169 |
| Depreciation Expense | 4,292,851 | 4,120,529 |
| Taxes | 643,757 | 570,945 |
| Total Operating Expenses | 54,675,360 | 47,356,037 |
| Operating Income | 2023 | 2022 |
|---|---|---|
| Total | 2,131,947 | 2,988,386 |
| Margins | 2023 | 2022 |
|---|---|---|
| Fixed Charges: Interest Expense | 1,865,805 | 1,740,596 |
| Operating Margins After Fixed Charges | 266,142 | 1,247,790 |
| G&T and Other Capital Credits | 991,812 | 938,433 |
| Net Operating Margins | 1,257,954 | 2,186,223 |
| Nonoperating margins: Interest Income | 304,659 | 260,435 |
| Other nonoperating revenue | 117,874 | 115,933 |
| Total nonoperating margins | 422,533 | 376,368 |
| Net Margins for the Year | $1,680,487 | $2,562,591 |
Statements are for the years ended December 31, 2024, and December 31, 2023.
| Assets | 2024 | 2023 |
|---|---|---|
| Cash | $55,812 | $47,677 |
| Contributions Receivable | 29,578 | 29,906 |
| Total Assets | 85,390 | 77,583 |
| Liabilities | 2024 | 2023 |
|---|---|---|
| Funds Payable | 35,000 | 47,000 |
| Net Assets | 2024 | 2023 |
|---|---|---|
| Without Donor Restriction | 50,390 | 30,583 |
| Total Liabilities and Net Assets | 85,390 | 77,583 |
| Revenue | 2024 | 2023 |
|---|---|---|
| Contributions of Cash and Other Financial Assets | 118,921 | 119,525 |
| Golf Tournament | 61,655 | 78,329 |
| Contributions of Nonfinancial Assets | 28,791 | 24,946 |
| Total Revenue | 209,367 | 222,800 |
| Expenses | 2024 | 2023 |
|---|---|---|
| Program Services | 152,218 | 184,207 |
| Management and General | 37,708 | 24,780 |
| Fundraising | 32,607 | 33,097 |
| Total Expenses | 222,533 | 242,084 |
| Changes in Net Assets | 2024 | 2023 |
|---|---|---|
| Change in Net Assets Before Contributed Services From Affiliate | (13,166) | (19,284) |
| Contributed Services From Affiliate | 32,973 | 22,628 |
| Change in Net Assets | 19,807 | 3,344 |
| Net Assets at Beginning of Year | 30,583 | 27,239 |
| Net Assets at End of Year | $50,390 | $30,583 |
| Cash Flows | 2024 | 2023 |
|---|---|---|
| Net Cash From Operating Activities | 8,135 | 6,294 |
| Cash at Beginning of Year | 47,677 | 41,383 |
| Cash at End of Year | $55,812 | $47,677 |